KPI card design: anatomy, examples and React code for dashboard metric cards
By Wolfpixel4 min read
A good KPI card answers three questions in under five seconds: what is the number, is it good or bad, and compared with what. Give it a plain label, one large value with its unit, a comparison stated in words (“+12% vs last month”), a colour that means something, and optionally a small trend line. Then put three to five of them at the top of the screen, ordered by the decision they drive.
Summarize withChatGPTClaudePerplexity
On this page
We are Wolfpixel. KPI cards are the most copied and least questioned piece of dashboard design. Across the six Ingot UI systems there are 67 KPI and stats components, drawn for very different products. This guide is what we learned designing them.
The anatomy of a KPI card
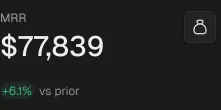
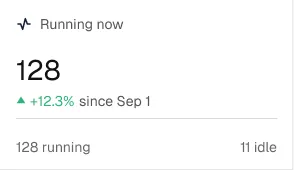
- 1Label. Plain words the user would say: “Revenue this month”, not “MRR_Δ”. Put the period in the label if it is not obvious.
- 2Value. The largest text on the card, with its unit. Use tabular numbers so values line up across cards.
- 3Comparison. Change against a baseline the user cares about (last period, target, plan). Write the baseline in words.
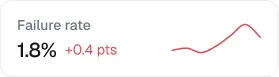
- 4Status colour. Green and red only when up is clearly good or bad. Churn going up is red, even though the arrow points up.
- 5Trend (optional). A small sparkline or bar strip for shape, not exact reading.
- 6Action (optional). A link to the list behind the number: “View 14 at-risk accounts”.
Rules for the comparison
- Match the period. Compare this week with last week, not with a monthly average.
- Prefer targets for goals. “82% of target” tells a sales lead more than “+4% vs last month”.
- Show absolute and relative change when small numbers would make percentages look dramatic. Going from 2 to 4 is “+100%”.
- Say when there is no baseline. “New this month” is better than an empty comparison slot.
- Do not rely on colour alone. Pair colour with a sign or arrow and text so colour-blind users read it too.
Sparklines: when they help and when they lie
A sparkline shows shape: rising, falling, spiky, flat. Use it when the trend changes the decision. Leave it out when the series has fewer than about six points, when the axis would need to start far from zero to show any movement, or when every card would show the same gentle slope. A row of identical squiggles is decoration.
KPI rows and strips
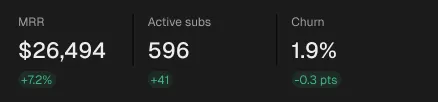
Three to five cards is the useful range. Order them by the decision they drive, left to right, and give the most important one either more width or the first position. When you need more than five, use a compact strip or mini KPIs and move detail to the page below.

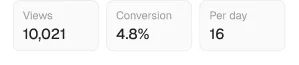

KPI cards by product type
| Product | Typical top-row KPIs | System to start from |
|---|---|---|
| Subscription business | MRR, net revenue retention, churn, at-risk accounts | Vantage, 17 KPI components |
| AI agent platform | Registered agents, running now, active policies, pending approvals | Auton, 15 |
| Workflow automation | Runs, failure rate, items in review queue, latency | Axon, 9 |
| Security tool | Open criticals, fixes this cycle, SLA met, verified fixes | Veriq, 11 |
| Newsletter or email | Subscribers, open rate, click rate, revenue per send | MailPulse, 9 |
| Marketing analytics | Audience growth, conversion, revenue, top source | Loopo, 6 plus the coded KPI card |
Accessibility and responsiveness
- Keep label and comparison text at 4.5:1 contrast. Muted greys on soft green backgrounds often fail; Ingot tokens include separate text tones for this (
--fu-positive-text). - Give the card one accessible name: label, value and comparison read in order.
- On mobile, stack cards two across, never four tiny ones. Shorten labels before you shrink the value.
- Decide truncation up front: long labels wrap to two lines; values never truncate.
Common mistakes
- Showing every metric the database has. If nobody acts on it, it does not belong in the top row.
- Rounding inconsistently: 12.4k next to 12,391.
- Green for “up” on metrics where up is bad (costs, churn, errors).
- Comparisons against a period that is not finished yet, which makes every month look like a drop until the last day.
Frequently asked questions
What should a KPI card include?
A plain label, one value with its unit, a comparison against a stated baseline, a status colour backed by text or an arrow, and optionally a sparkline and a link to the detail.
How many KPI cards should a dashboard have?
Three to five in the top row, ordered by the decision they drive. Use a compact strip if you truly need more.
Should KPI cards have sparklines?
Only when the shape of the trend changes the decision and there are enough data points. Otherwise they are decoration.
Is there a free KPI card React component?
Yes. The Loopo KPI card in Ingot UI is free React and Tailwind code, installable with npx ingotui add kpi-card or the shadcn CLI.
About the author
Wolfpixel is the product design studio that designed the six Ingot UI systems from real dashboard projects, and checks every generated React component against its Figma original before it ships. Read more on wolfpixel.agency.