Why AI-built dashboards look generic, and 7 fixes that work
By Wolfpixel5 min read
AI-built dashboards look generic because a model with no design context returns the most common pattern it has seen: default theme, grey cards, a blue line chart and a table with no states. The fix is context, not a longer prompt. Give the agent your tokens, a library of real components, a brief written around decisions, and a rule to audit its own output. Those four changes do more than any amount of “make it beautiful”.
Summarize withChatGPTClaudePerplexity
On this page
We are Wolfpixel. Founders now send us dashboards they built in a weekend with an AI tool and ask why it “looks like every other startup”. It is a fair question with a concrete answer, and almost always the same seven fixes.
The tell-tale signs of a vibe-coded dashboard
- Four identical KPI cards, each with a big number and a green or red percentage, none telling you what to do.
- A smooth gradient area chart with sine-wave data and no axis labels you would trust.
- Purple-to-blue gradients, glassy cards and drop shadows on everything.
- A table with perfect rows and no empty, loading or error state.
- Spacing that is almost consistent: 14px here, 16px there, 18px in the modal.
- Icons from three different sets on one screen.
Why it happens
Models are trained on enormous amounts of public UI code, and much of the recent public code uses the same defaults. Ask for “a dashboard” and you get the statistical middle of that data. Every tool that runs on similar models produces a similar middle, so products converge. More adjectives in the prompt move the output a little; they do not give it a system.
7 fixes that work
1. Give the agent tokens before the first screen
Colours, radii, spacing and type as CSS variables, written into the project before any UI exists. Agents follow what is in the repo. If --fu-accent and --fu-radius-md exist, they get used. Our Tailwind v4 tokens guide has a starter set.
2. Give it real components, not screenshots
A screenshot shows the surface; a component carries the decisions (padding, states, hover, truncation). Connect a component library through MCP so the agent imports pieces instead of redrawing them. Ingot UI has 1,738 components with React code an agent can pull through its MCP server.
3. Write the brief around decisions
“A dashboard for my analytics product” gives the model nothing. “The user opens this every morning to decide which campaign to pause; show spend against target, the worst three campaigns and a pause action” gives it a layout. Name the user, the decision and the action.
4. Pick one domain system and stay in it
A newsletter product, an AI agent console and a security tool need different screens. Starting from a system built for your domain means the specialist pieces already exist: MailPulse for email, Auton for agents, Axon for workflows, Veriq for security, Vantage for business admin, Loopo for analytics.
5. Set chart rules
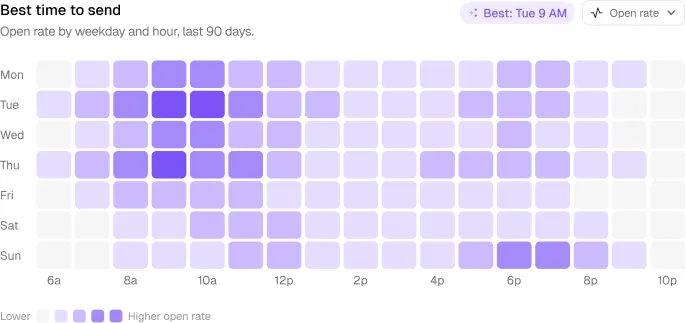
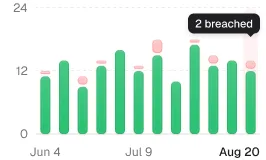
Tell the agent: bars start at zero, no smooth curves on sparse data, label the axis, show the comparison, use the accent for the one series that matters and grey for the rest. Or use chart components that already follow these rules; see choosing dashboard charts.
6. Demand every state
Add one line to your agent rules: every list and table ships with empty, loading, error and no-results states. It costs the agent seconds and is the single biggest signal of a finished product.
7. Make the agent audit itself
After each screen, ask the agent to check for hard-coded colours, off-scale spacing and mixed icon sets, then fix them. Ingot UI’s audit_ui tool does this against the system’s tokens. A two-minute audit catches most of the drift that makes a product feel assembled.
A rules file you can copy
UI rules
- Use only tokens from styles/ingot (no hex values in components).
- Import components from the Ingot UI library before writing new ones.
- One accent colour per chart; other series grey.
- Every table and list has empty, loading, error and no-results states.
- Icons from one set only.
- Run audit_ui after every screen and fix what it reports.
When to bring in a designer
AI with a system gets you to a solid, consistent product. It does not decide what your product should emphasise, which metric earns the top-left corner, or how onboarding should feel. That is design work. Use agents for assembly; spend your design time on the two or three screens that make your product yours.
Frequently asked questions
Why does every AI-generated dashboard look the same?
Because models return the most common patterns in their training data, and recent public UI code shares the same defaults. Without your own tokens and components in context, every tool converges on a similar look.
How do I make Claude Code or Cursor follow my design system?
Put tokens and components in the repo or behind an MCP server, add a rules file that tells the agent to use them, and ask it to audit its output after each screen.
Is vibe coding good enough for a production dashboard?
For internal tools, often yes. For a product customers pay for, use it for assembly on top of a real design system, and review states, charts and copy by hand.
Which AI tools work with Ingot UI?
Any MCP client such as Claude Code, Cursor, VS Code or Codex. Tools without MCP can still use the components through the CLI or by copying code from component pages.
About the author
Wolfpixel is the product design studio that designed the six Ingot UI systems from real dashboard projects, and checks every generated React component against its Figma original before it ships. Read more on wolfpixel.agency.