Dashboard chart types: how to pick the right chart, with React components
By Wolfpixel4 min read
Pick a dashboard chart by the question it answers. Comparing categories: bars. Change over time: a line or columns. Part of a whole with two to four parts: a donut or a stacked bar. Steps where people drop off: a funnel. Patterns by day and hour: a heatmap. Cohorts over time: a retention grid. Then make it honest (bars start at zero, label the axis, highlight one series) and give it a hover state.
Summarize withChatGPTClaudePerplexity
On this page
We are Wolfpixel. Charts are where dashboards win or lose trust. The six Ingot UI systems contain 248 chart components, 238 of them with React code so far, and each was drawn for a real question in a real product. This guide maps those questions to chart types.
Match the chart to the question
| Question | Chart | Example component |
|---|---|---|
| Which is biggest? | Horizontal bars, sorted | Sources card |
| How did it change over time? | Line, or columns for discrete periods | Transaction value trend |
| How much of the target are we at? | Progress bar or meter | Pill meter |
| What is the mix? | Donut (two to four parts) or stacked bar | Donut |
| Where do people drop off? | Funnel | Engagement funnel |
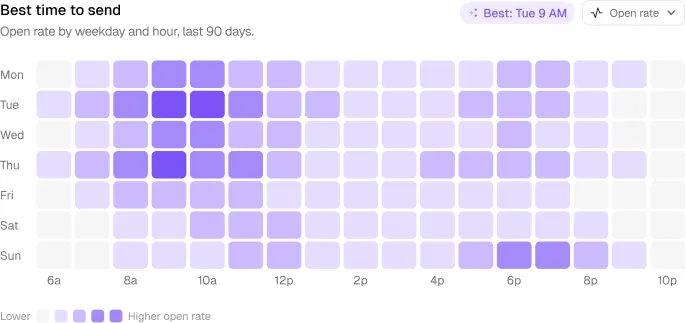
| When does activity peak? | Heatmap by day and hour | Best time to send |
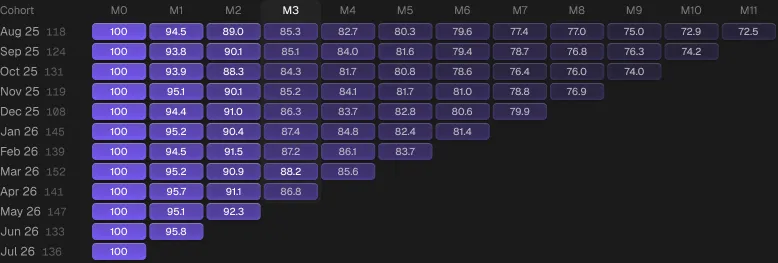
| Do cohorts stick? | Retention grid | Retention grid |
| Are we meeting the SLA? | Columns against a target line | SLA weekly chart |
| What moved the total? | Net movement or waterfall | Net movement chart |
Honesty rules
- Bars start at zero. A bar’s length is its value; cutting the axis exaggerates differences.
- Lines may zoom, but say so with a labelled axis.
- No smoothing on sparse data. Curved interpolation between six points invents peaks that never happened.
- Same scale for small multiples, or readers compare shapes that are not comparable.
- Incomplete periods look like drops. Mark the current period as partial or leave it out.
- Donuts for few parts only. Beyond four slices, use sorted bars.
Design details that make a chart look finished
Most dashboard charts look unfinished for the same reasons: flat default bars, thin axis text, too many colours and no hover state. These are the details we apply across Ingot systems:
- One accent series. The series that matters gets the system accent; everything else is grey or a tint.
- Depth on bars. A subtle gradient, a soft inner stroke and a highlight band on the selected period, so bars read as objects instead of rectangles.
- Real-looking data in mocks. Dense, irregular series. Perfect sine waves tell users the chart is fake.
- Annotations. A pill on the peak or on today’s value states the takeaway in words.
- A hover state for every mark. Tooltip with the exact value, period and comparison.
- Tabular numbers on axes and tooltips so values align.
Charts by system
| System | Charts in Figma | With React code | Signature charts |
|---|---|---|---|
| Loopo | 32 | 32 + 7 hand-built | Capsule bars, audience growth, sources |
| MailPulse | 22 | 22 | Send-time heatmap, engagement funnel, revenue over time |
| Auton | 58 | 56 | Request and policy detail views |
| Axon | 42 | 40 | Run and latency views, workspace widgets |
| Veriq | 51 | 50 | SLA weekly chart, plan usage |
| Vantage | 43 | 38 | Retention grid, funnel, net movement, projections |
Choosing a React chart library underneath
Ingot chart components are plain React and SVG on Tailwind, so they carry no chart library dependency. If you need interactions they do not cover (zoom, brushing, thousands of points), use a dedicated library such as Recharts, Visx or ECharts and apply the same rules above: zero baselines, one accent, labelled axes and hover states.
Frequently asked questions
What are the most common dashboard chart types?
Bar charts for comparing categories, line charts for change over time, donuts or stacked bars for simple part-to-whole, funnels for drop-off, heatmaps for timing patterns and retention grids for cohorts.
When should I use a donut chart on a dashboard?
Only for two to four parts of a whole where the share matters more than exact values. For more parts, use a sorted bar chart.
Are Ingot UI charts built on a chart library?
No. They are React and SVG components styled with Tailwind and the system tokens, so they add no chart library dependency.
How many charts should a dashboard have?
As many as there are distinct questions the user needs answered on that screen, usually two to four. Repeat charts belong on a report, not a dashboard.
About the author
Wolfpixel is the product design studio that designed the six Ingot UI systems from real dashboard projects, and checks every generated React component against its Figma original before it ships. Read more on wolfpixel.agency.