Data table design for React dashboards: the 12 decisions that matter
By Wolfpixel3 min read
A good dashboard table puts the identifying column first and the action last, shows status as a chip, keeps rows at a consistent density, hides row actions in a menu, offers filters in a popover and a search field, and designs the empty, loading, error and no-results states before launch. Detail opens in a drawer so people keep their place.
Summarize withChatGPTClaudePerplexity
On this page
We are Wolfpixel. Tables are where users spend most of their time in a B2B product, and where most dashboards look unfinished. The six Ingot UI systems contain 235 table and list components; these are the decisions we make every time.
The 12 decisions
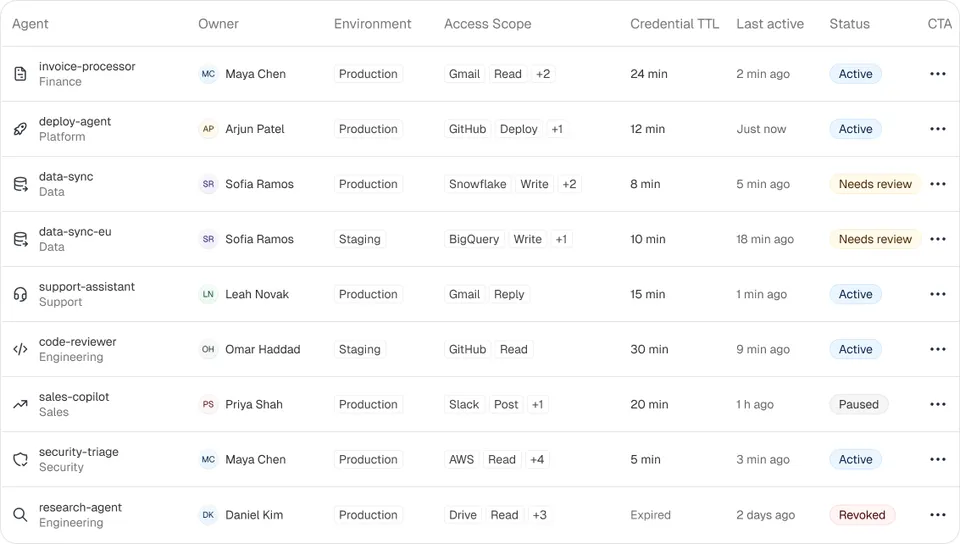
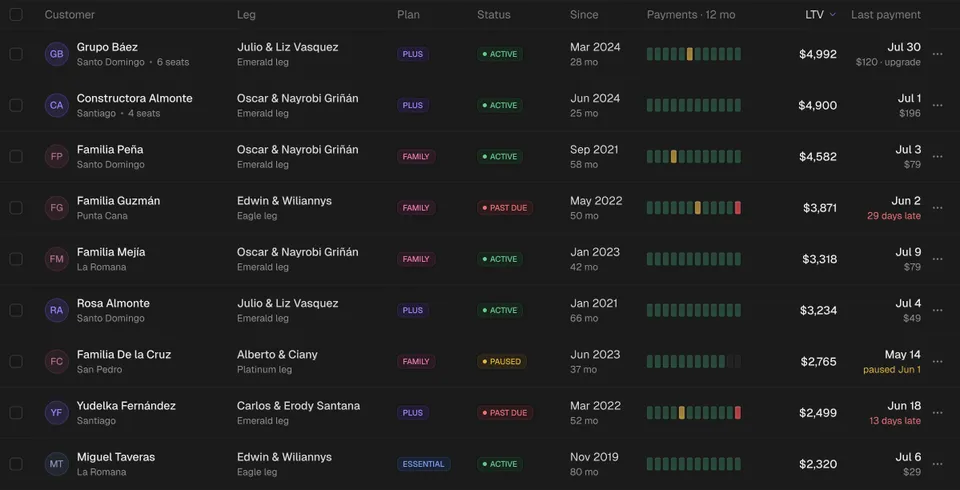
- 1First column identifies the row. Name plus a secondary line (email, ID). Make it the link to the detail.
- 2Columns ordered by decision value, not by database order. What do people scan to decide?
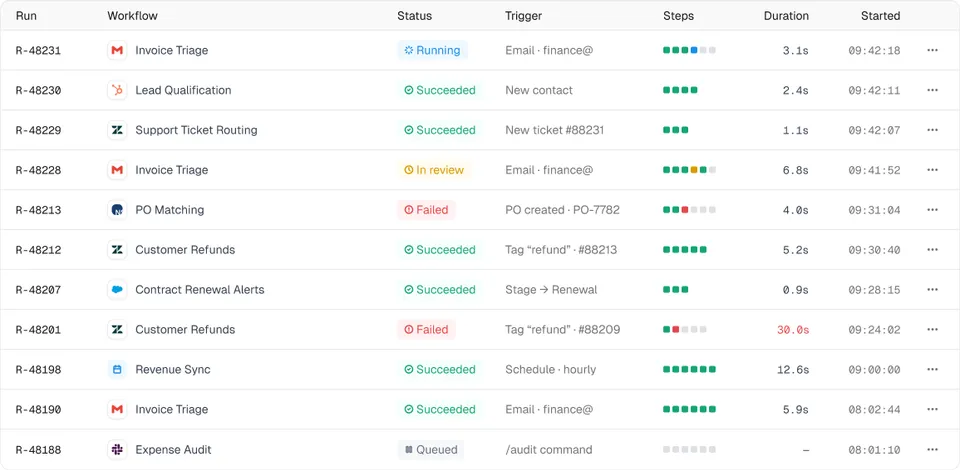
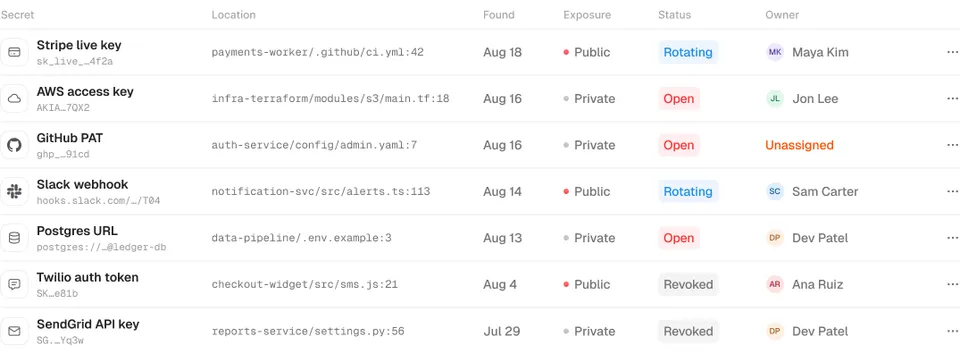
- 3Status as a chip with text, not colour alone.
- 4Numbers right-aligned with tabular figures and consistent units.
- 5Dates relative when recent (“2 h ago”) with the exact time on hover.
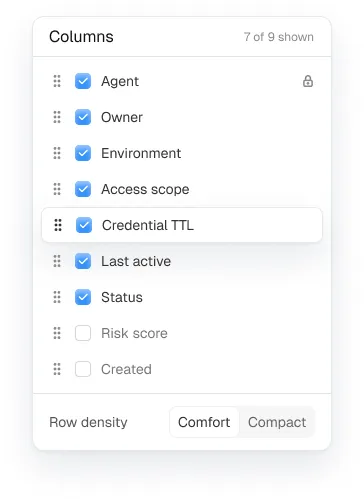
- 6Density chosen on purpose: 36 to 40px rows for work tables, 48px for light lists.
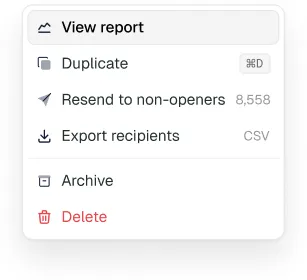
- 7Row actions in a menu at the end of the row, plus a few bulk actions when rows are selected.
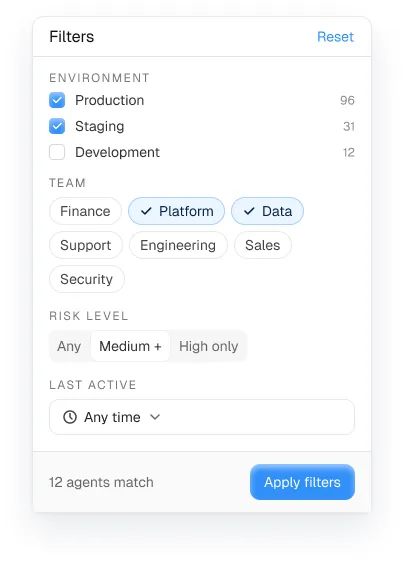
- 8Filters in a popover or filter bar, with active filters shown as removable chips.
- 9Sorting on the columns people actually sort. Not every column needs it.
- 10Pagination or “load more” with a visible count. Infinite scroll hides the end.
- 11States: empty, loading (skeleton rows), error with retry, and no results with a clear-filters action.
- 12Detail in a drawer opened from the row, so the list stays in view.
Filters, columns and search
Put search on the left of the toolbar and filters next to it. Show active filters as chips that can be removed one by one, and a “clear all”. Let people hide columns on wide tables, and remember their choice.

Empty and no-results states
An empty table on first use should explain what will appear and offer the action that creates the first row. A no-results state should say which filters caused it and offer to clear them. They are different screens; see empty state design.
Implementation notes for React
- Use TanStack Table for sorting, filtering and selection logic; keep the markup your own.
- Virtualise only when you render hundreds of rows at once; paginate otherwise.
- Keep the toolbar and header sticky on long pages.
- Put filter state in the URL so views can be shared and bookmarked.
- Use a real
<table>for tabular data; screen readers depend on it.
Mobile
Don’t squeeze eight columns onto a phone. Turn each row into a card with the identity, the status and one key number, and move the rest into the drawer.
Frequently asked questions
What makes a good data table design?
Identity first, columns ordered by decision value, status as chips with text, right-aligned numbers, row actions in a menu, filters with visible chips, and designed empty, loading, error and no-results states.
Should I use pagination or infinite scroll in a dashboard table?
Pagination or a load-more button with a visible count. Infinite scroll hides the end of the list and makes footers unreachable.
What is the best React table library?
TanStack Table is the common choice for logic (sorting, filtering, selection) while you keep your own markup and styles.
Are Ingot UI tables free?
The Loopo data table and ranked list are free React components. Pro systems add table components for agents, runs, customers, secrets and more.
About the author
Wolfpixel is the product design studio that designed the six Ingot UI systems from real dashboard projects, and checks every generated React component against its Figma original before it ships. Read more on wolfpixel.agency.