How to build a shadcn dashboard that doesn’t look like every other one
By Wolfpixel4 min read
To build a shadcn dashboard, start a Next.js project with Tailwind v4, add the shadcn primitives you need (sidebar, card, table, dialog, dropdown), lay out a shell with a sidebar and page header, then fill it with a KPI row, one or two charts and a table with every state. The step most teams skip is the look: swap the default theme for your own tokens and use finished dashboard components, or it will look like every other shadcn app.
Summarize withChatGPTClaudePerplexity
On this page
We are Wolfpixel. We build dashboards on shadcn/ui for clients, and the pattern is always the same: the first version takes a day and looks like the shadcn example, the second takes three weeks and finally looks like the product. This guide shortens the second part.
What a shadcn dashboard is made of
| Layer | shadcn gives you | You still need |
|---|---|---|
| Shell | Sidebar, sheet, breadcrumb | Your information architecture and a page header pattern |
| Overview | Card | KPI cards with comparisons, a layout that puts the decision first |
| Charts | Chart wrapper on Recharts | Chart choices per question, one accent, annotations |
| Records | Table, data table example | Filters, row actions, empty and loading states, a detail drawer |
| Overlays | Dialog, sheet, popover, dropdown | The actual create, confirm and connect flows |
| Look | A neutral default theme | Your tokens: colour, radius, type, density |
Step 1: set up the project and tokens first
npx create-next-app@latest my-dashboard
cd my-dashboard
npx shadcn@latest init
npx shadcn@latest add sidebar card table dialog dropdown-menu
Before building a single screen, decide your tokens: page and surface colours, one accent, status colours with text-safe tones, radius and type. Changing them later means touching every file. Our Tailwind v4 tokens guide has a starter set, or install a finished one:
npx ingotui init
npx shadcn add https://ingotui.com/r/kpi-card.json
Step 2: build the shell
Sidebar on the left, page header on top, content in a max-width container. Keep the sidebar to the five to seven areas people use weekly; settings and help go at the bottom. The page header holds the title, the page’s one primary action and anything that changes the whole page, such as a date range.



Step 3: the KPI row
Three to five cards, ordered by the decision they drive. Every card needs a comparison in words. A shadcn Card plus a number is not a KPI card; it is a number in a box. See KPI card design for the anatomy.

Step 4: charts that answer one question each
shadcn’s chart wrapper is a thin layer over Recharts, which is a good default. The harder part is choosing the chart and styling it so it looks finished: zero baselines, one accent series, labelled axes and hover states. Choosing dashboard charts maps questions to chart types.
Step 5: the table, with every state
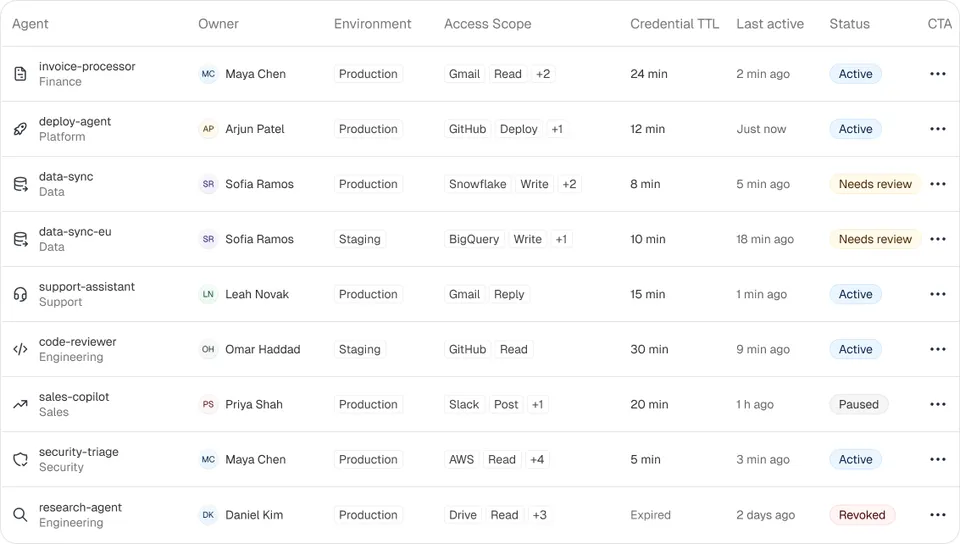
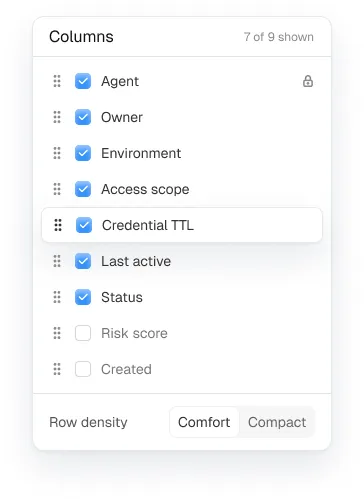
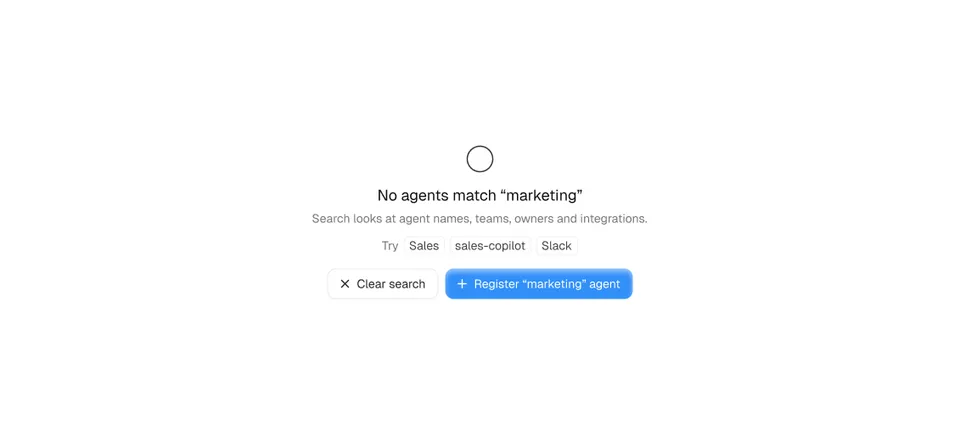
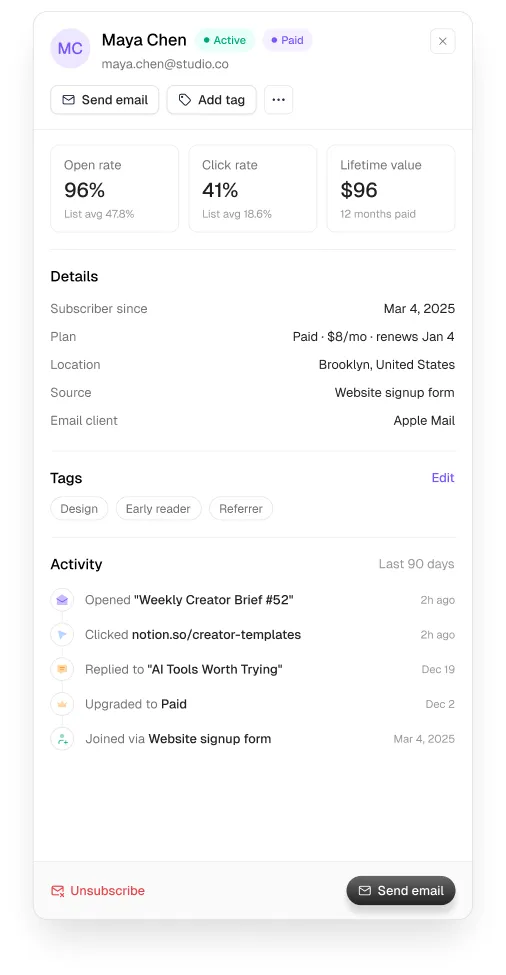
Start from the shadcn data table example (TanStack Table under the hood) and add what real products need: status chips, a row menu, filters in a popover, a column picker, empty and no-results states, and a drawer for the detail. Our data table design guide covers each.
Step 6: make it look like your product
- Change the radius and the accent first. Those two tokens move the look further than anything else.
- Use one icon set. Mixing Lucide with other sets is a tell; pick one and keep the stroke width consistent.
- Set density on purpose. Admin tools want tighter rows (36 to 40px); analytics overviews want air.
- Use tabular numbers everywhere values line up.
- Pick a domain system if your product has one: MailPulse for email, Auton for AI agents, Axon for workflows, Veriq for security, Vantage for business admin.
Common mistakes
- Shipping the example dashboard’s fake data layout because it “looks full”.
- Four KPI cards with no comparison.
- A table without empty, loading and error states.
- Modals for everything, including record detail that should be a drawer (modal vs drawer).
Frequently asked questions
Is there a free shadcn dashboard template?
shadcn/ui publishes dashboard examples and blocks you can copy. For a finished, domain-specific look, the free Loopo system in Ingot UI installs alongside shadcn.
Does Ingot UI work with shadcn/ui?
Yes. Ingot UI uses React, Tailwind CSS v4 and Base UI, and free components are published as shadcn registry items, so npx shadcn add works.
What chart library does shadcn use?
shadcn/ui’s chart components wrap Recharts. You can use any React chart library, or chart components that render plain SVG.
How long does a shadcn dashboard take to build?
A shell with sample data takes a day. A product-quality dashboard with real states, overlays and your own look takes weeks unless you start from finished components.
About the author
Wolfpixel is the product design studio that designed the six Ingot UI systems from real dashboard projects, and checks every generated React component against its Figma original before it ships. Read more on wolfpixel.agency.